Bakery inventory management comes down to three artifacts: a count sheet organized by shelf life, a par level for every ingredient that moves, and a waste log somebody actually fills in at the end of service. A bakery doing $12,000 a month in purchasing typically carries $600–900 a month in avoidable loss — stale product, dough scaled for an order that got cut, butter ordered twice because nobody walked the cooler first. Below is the sheet structure, the par-level math with worked numbers, and the benchmarks to measure yourself against.
Why does bakery inventory go stale faster than café inventory?
A café tracks maybe 60 to 90 items, and most of them are stable — beans, syrups, cups, shelf-stable oat milk. A bakery tracks 150 to 300, and a third of them are on a clock measured in hours rather than months.
Two things follow from that table. First, a single weekly count is the wrong shape for a bakery — it is right for flour and boxes and useless for thawed dough. Second, your volume and your risk sit in different places. Flour is most of your purchasing dollars; butter, eggs, fillings, and thawed laminated dough are most of your loss.
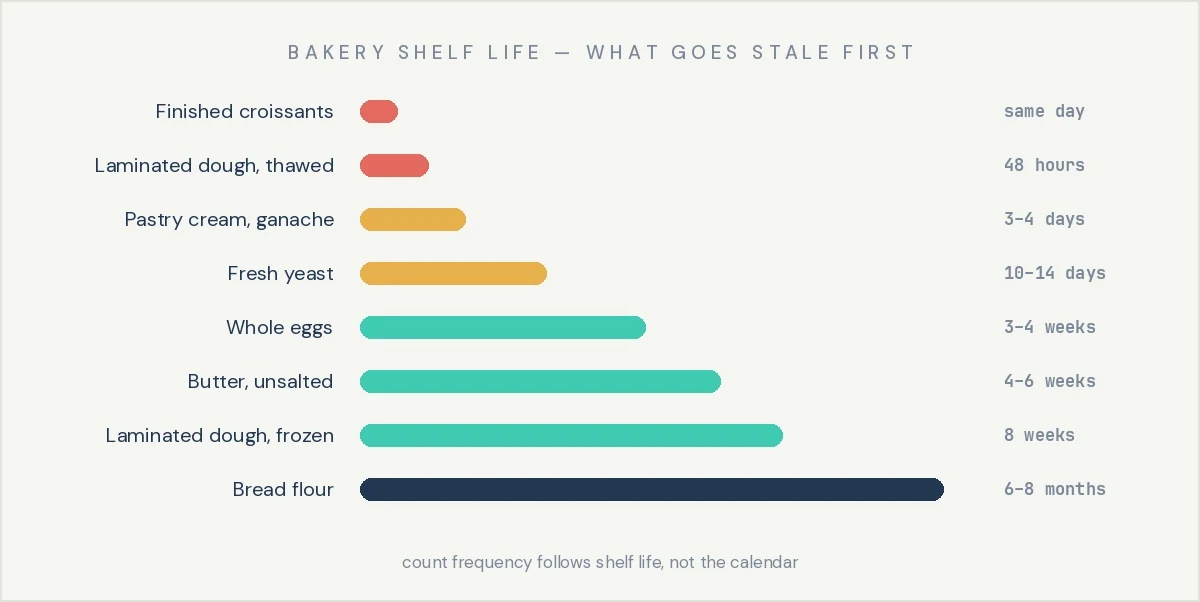
The takeaway: count by shelf life, not by calendar — anything with a life under 72 hours has to be counted on the day it gets used.
What goes on a bakery inventory sheet?
Nine columns. Any fewer and you cannot cost the count; any more and nobody finishes it.
The column that gets dropped and shouldn't is the pair of count unit and purchase unit. Bakers count butter in pounds and buy it in 36 lb cases. They count fresh yeast in blocks and buy it in 10-block cartons. If the sheet doesn't hold both units and the conversion, every order becomes mental arithmetic at 4:30 in the morning, and those errors run in one direction: over.
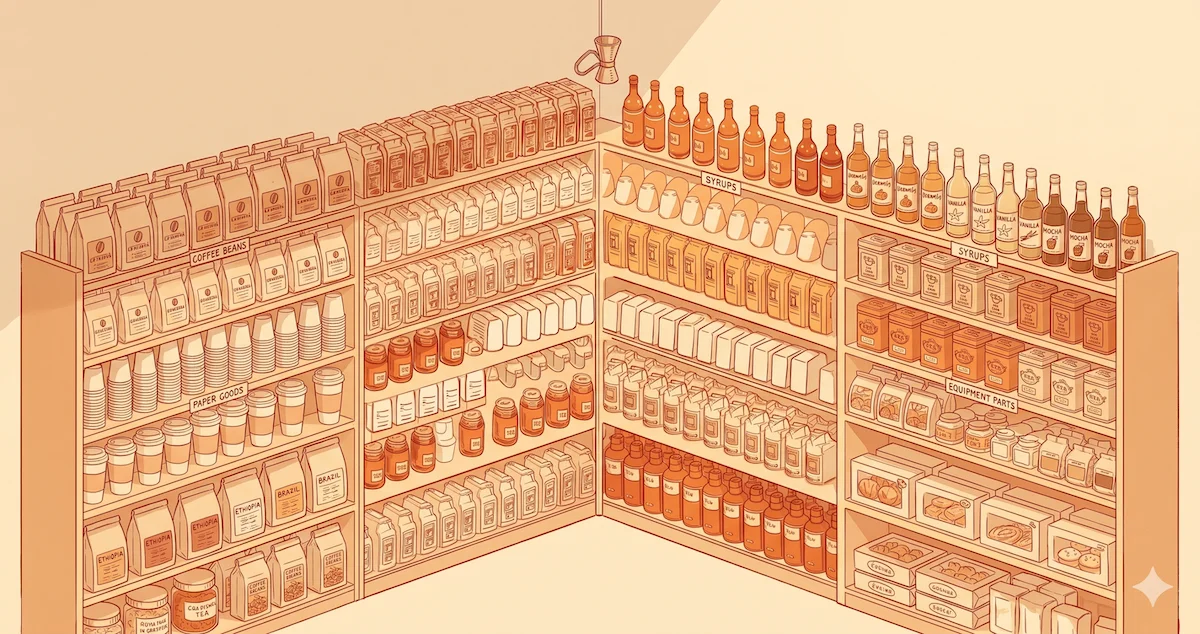
Order the rows by storage area, not alphabetically. One pass through the walk-in, one through dry storage, one through the freezer, one through the packaging shelf, no backtracking. That single change usually takes ten minutes off a count. The same logic drives the café inventory count sheet template — a bakery version is just longer and split into more zones.
The takeaway: a sheet ordered by physical location gets finished; a sheet ordered alphabetically gets abandoned somewhere in the freezer.
How do you set bakery par levels?
A par level is how much you want on hand at the moment you count, set so you don't run out before the next delivery lands.
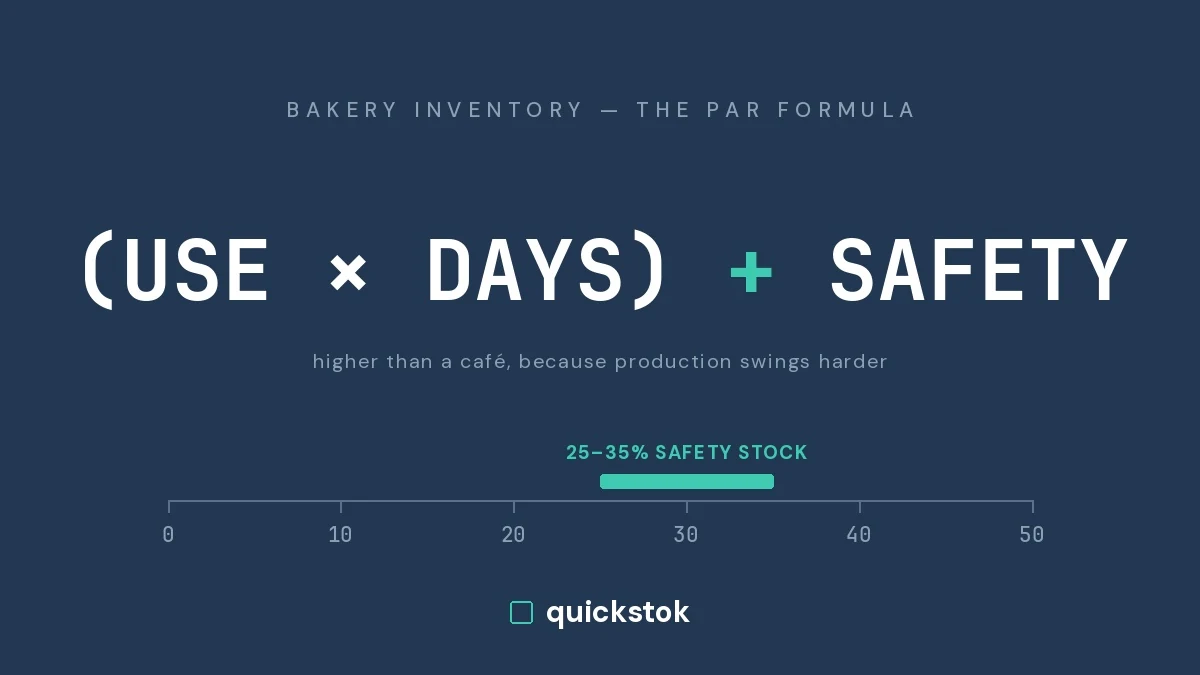
Par = (average daily usage × days until next delivery) + safety stock
Safety stock in a bakery should sit at 25–35% of the covered period, not the 15–20% that works in a café. Production swings harder: one wholesale account adding a Saturday order moves flour usage 20% in a week, and a holiday weekend can double butter.
Two rules keep par levels from becoming the thing that causes the waste. First, never set a par that holds more than half of an item's remaining shelf life. A three-case butter par is fine at 22 lb a day; a six-case par means the last case sits five weeks and you are buying rancidity in advance. Second, rewrite pars twice a year — once in early October before holiday volume, once in March when it drops back. A par set in February will strand you in December.
If the difference between a par and a reorder trigger isn't obvious yet, this breakdown of par levels covers it in a page.
The takeaway: par is a number per item per delivery day, not a single number for the bakery, and it should be rewritten at least twice a year.
What is a good bakery food cost percentage?
Bakery food cost runs lower than full-service restaurant food cost and higher than coffee, and it varies enormously by product line — which is exactly why a single blended number hides the problem.
A retail bakery should land at a blended 28–32% including packaging. Above 35%, it is nearly always one of three causes: butter bought at spot price instead of on contract, yields that don't match the recipe card (the sheet says 24 croissants and the tray gives you 22), or waste that never enters the cost at all.
Packaging deserves its own line. Boxes, cake rounds, liners, sleeves, and bags run 3–6% of revenue at a bakery versus roughly 1–2% at a café, and because none of it spoils, most operators never count it. A food cost calculator built for cafés handles bakery math fine — just add packaging as a cost line per item rather than burying it in overhead.
The takeaway: a bakery that leaves packaging out of food cost is under-reporting by three to six points.
Where does bakery waste actually come from?
Most operators go after failed bakes first, because a collapsed loaf is visible and it stings. The money is somewhere quieter.
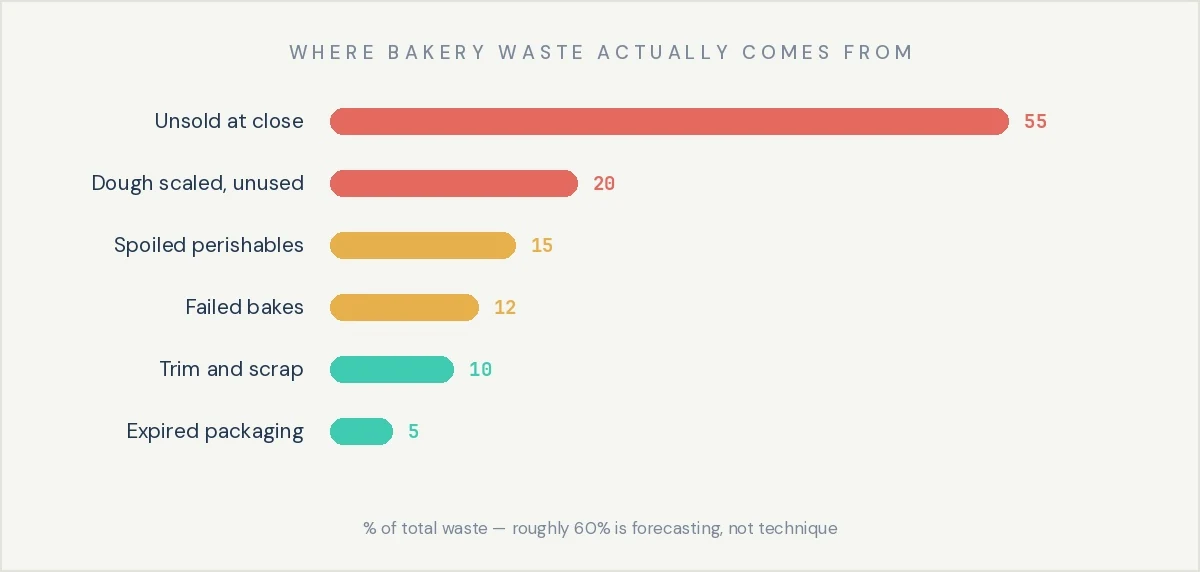
Roughly 60% of bakery waste is a forecasting problem, not a technique problem. That is good news, because forecasting responds to written records, and technique responds to hiring.
The record you need is six columns and takes under 30 seconds an entry: date, item, quantity, reason, cost, initials. Kept honestly for two weeks, it stops being an opinion about waste and becomes a ranked list you can act on. The café waste log template is the exact structure — add a "production run" column so you can tell a 6 a.m. bake from a 1 p.m. top-up.
The takeaway: you cannot reduce waste you haven't named, and the log is the naming.
How often should a bakery count inventory?
Three cadences, not one. The full set costs about 90 minutes a week spread across the team.
The monthly full count is the one people skip, and it is the one that finds four cases of holiday liners from two Decembers ago. It is also what makes your food cost number real, because a partial count silently assumes zero drift on everything you didn't touch.
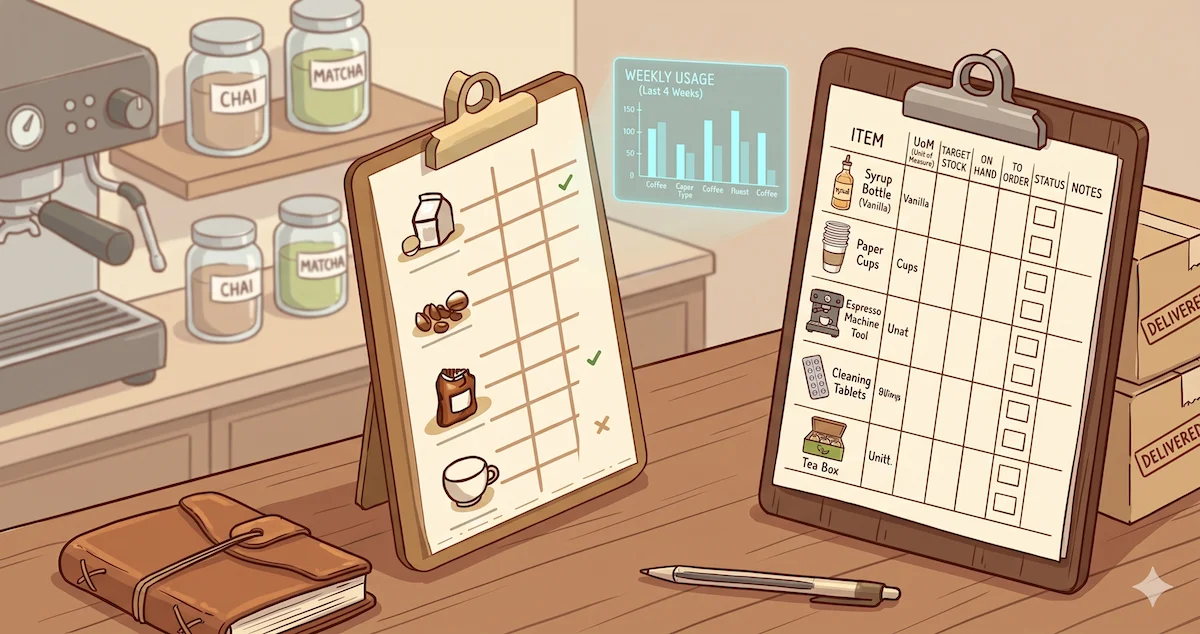
Clipboard, spreadsheet, or software matters less than whether the same person counts on the same day each week. Whatever you use, the tool should do the par-versus-on-hand subtraction for you — that arithmetic at 4:30 in the morning is where ordering errors come from.
The takeaway: three cadences beat one weekly count, and the monthly full count is what keeps your food cost number honest.
What does the first month look like?
Don't build the whole system in week one. Nobody sustains that.
By the end of week four you have a baseline, and most bakeries find their first fix inside that window. It is usually the same one: the last bake of the day is set from habit rather than last week's sell-through. Cutting it by 15% on the two slowest days is typically worth $150–250 a month on its own, and it costs nothing but the decision.
The takeaway: four weeks of ordinary discipline produces a baseline, and the baseline is what makes every decision after it cheap.